Are you spending too much on energy costs?
Now that we’ve covered how greenhouse design can save you on lighting costs, and the pros and cons of HPS and LED lights, we’ll discuss how you can increase lighting efficiencies in your commercial cannabis greenhouse with a smart lighting strategy.
Let’s review some lighting terms before we get into the examples. Light, at its most basic unit, is described in moles. Moles allow us to describe light as finite quantities of photons. And since a mole is a large number, quantities of light particles (photons) are usually measured in micromoles – µmol (there are one million micromoles in a mole).
Example: One mole of light is a package of 620 000 000 000 000 000 000 000 photons, and a package of a micro-mole is with six fewer zeros: 620 000 000 000 000 000 photons.
Now that we know the basic unit of light, there are a couple of ways to conduct light readings in your greenhouse. One way is to measure PPFD or photosynthetic photon flux density. PPFD is the total amount of light (number of photons measured in micromoles) within the PAR range (the range of light that plants use for photosynthesis) that hits a given area of plant canopy every second.
Consider a paper sheet of a square meter. The number of photons that reach that sheet every second is called the Photosynthetic flux density (PPFD) expressed in µmol/(m².s).
Another method is to measure DLI or daily light integral. DLI is the total sum of moles of photons per meter squared per day (mol/m2/d). If you are growing in a greenhouse, it’s important to know how much sunlight your plants are getting over the course of a day, and how DLI changes season to season. You can’t establish an effective supplemental lighting strategy without knowing the DLI provided by the sun in your greenhouse.
For more information on LED lights and how plants use the light spectrum, our partners at Resource Innovation Institute have provided a free downloadable PDF report that you can accesshere.
Now that we’ve reviewed these terms, let’s take a look at a couple of lighting graphs from two energy consumption predictions we conducted for two greenhouses based in Boulder, Colorado.
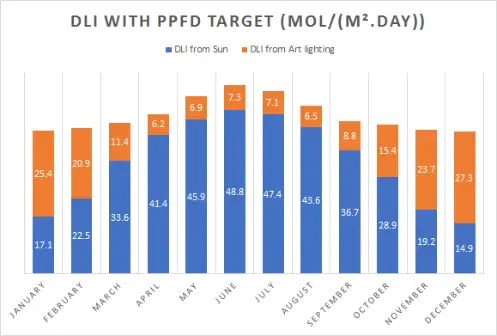 Greenhouse #1 yearly lighting cost: $19,173
This graph shows the average DLI per month this greenhouse prediction receives over the course of one year from the Sun. The blue portion of the columns represents DLI from the sun and the orange represents DLI from LED artificial lighting. Obviously the majority of a greenhouse’s energy comes from the sun.
It’s important to note that cannabis plants need a minimum of 35 DLI during their flowering stage. That being said, we see that the grower in this example is turning on supplemental lighting during months when it may appear unnecessary. That’s because the grower is controlling their greenhouse lighting according to PPFD measurements. PPFD is a fairly incremental way to measure light levels. If the sensors pick up low light levels in the greenhouse, let’s say due to temporary cloud cover, the LEDs will turn on at the end of a sunny day when the DLI required has already been reached.
There is a way that you can make your supplemental lighting strategy more efficient in order to increase your energy savings without compromising yield. Let’s take a look at the lighting strategy in greenhouse number two.

Greenhouse #2 yearly lighting cost: $12,277
This graph represents a greenhouse in the same climate as the first greenhouse but with some obvious differences. From May to September this grower is using little to no supplemental lighting. That’s because they control their supplemental lighting according to DLI measurements and forecasting algorithms. This grower combines PPFD sensors with a smart computer that forecasts the sum of PPFD throughout the day to ensure they’re only running supplemental lights when absolutely necessary. This lighting strategy saves growers considerably on energy costs and reduces the risk of cannabis plants getting too much light.
With an indoor grow operation, your desired DLI level is achieved solely from artificial lights. Indoor growers can achieve consistent and calculated lighting schedules to hit desired DLI levels, but their energy costs will always run higher due to the fact that these lights run all day, every day. In fact, our predictive analysis of a standard indoor grow room tells us that the lighting intensity needed for 3,000 sq ft of canopy will cost growers around$65,040 per year. This is a massive increase compared to energy consumption predictions from greenhouse 1 and 2. The bottom line is, the sun is free and much more powerful than any artificial light.
Why wouldn’t you use the sun within a smartly controlled greenhouse environment?
 This last graph compares all three lighting scenarios so you can see electricity costs month over month. From this figure, we can conclude that integrating a level of software development with smart algorithms in addition to your PPFD sensors can increase efficiency and save you money on energy costs. By controlling your lighting according to DLI readings, you will establish a smarter lighting strategy because you will be tracking lighting data that matters more for the bigger picture. For questions about supplemental lighting in your commercial cannabis operation, contact a greenhouse designer today.