What is Vapor Pressure Deficit?
Vapor Pressure Deficit (VPD) is a pressure value that combines both temperature and relative humidity(RH). VPD allows growers to understand stress in their plants. It is a measure of the evaporation potential, or the difference in “wetness” (the amount of water vapor), of the air at the leaf versus the “wetness” of the air in the greenhouse.
When VPD is too low, indicating low temperatures and/or high humidity, it inhibits the plant from evaporating water from the leaf, which can block the transport of minerals from the roots to the growing plant cells. When VPD is too high excessive evaporation may cause the leaf stomata to close, halting photosynthesis in the plant, and the excessive heat in the plant can cause injury.
For a basic explanation of VPD, seeAn Introduction To Vapor Pressure Deficit.
Why tracking temperature and relative humidity isn’t enough
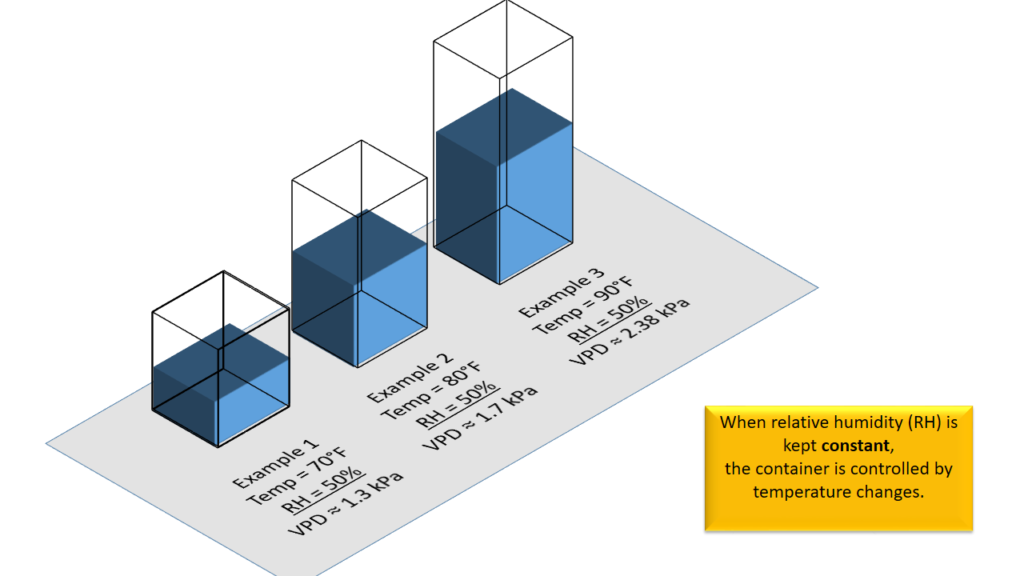
Most growers use temperature and RH as set points for their greenhouse (i.e. turn on the HVAC system if the temperature goes above 76 degrees, or misters if RH drops below 40%). However, this is an incomplete view of the environment. If they controlled the greenhouse to stay at a 50% RH setpoint and the temperature increases 20°F, the capacity of the air to hold water approximately doubles, increasing VPD significantly.
The reality is even more complex. All HVAC systems change both temperature and RH, potentially stressing the plants when trying to create a healthy environment.
Understanding Vapor Pressure Deficit
Let’s look at an example to illustrate this complexity. The VPD chart below shows VPD calculated at a given temperature and RH. Dark green is a healthy range for the vegetative stage of growth, and yellow is a healthy range for flowering:
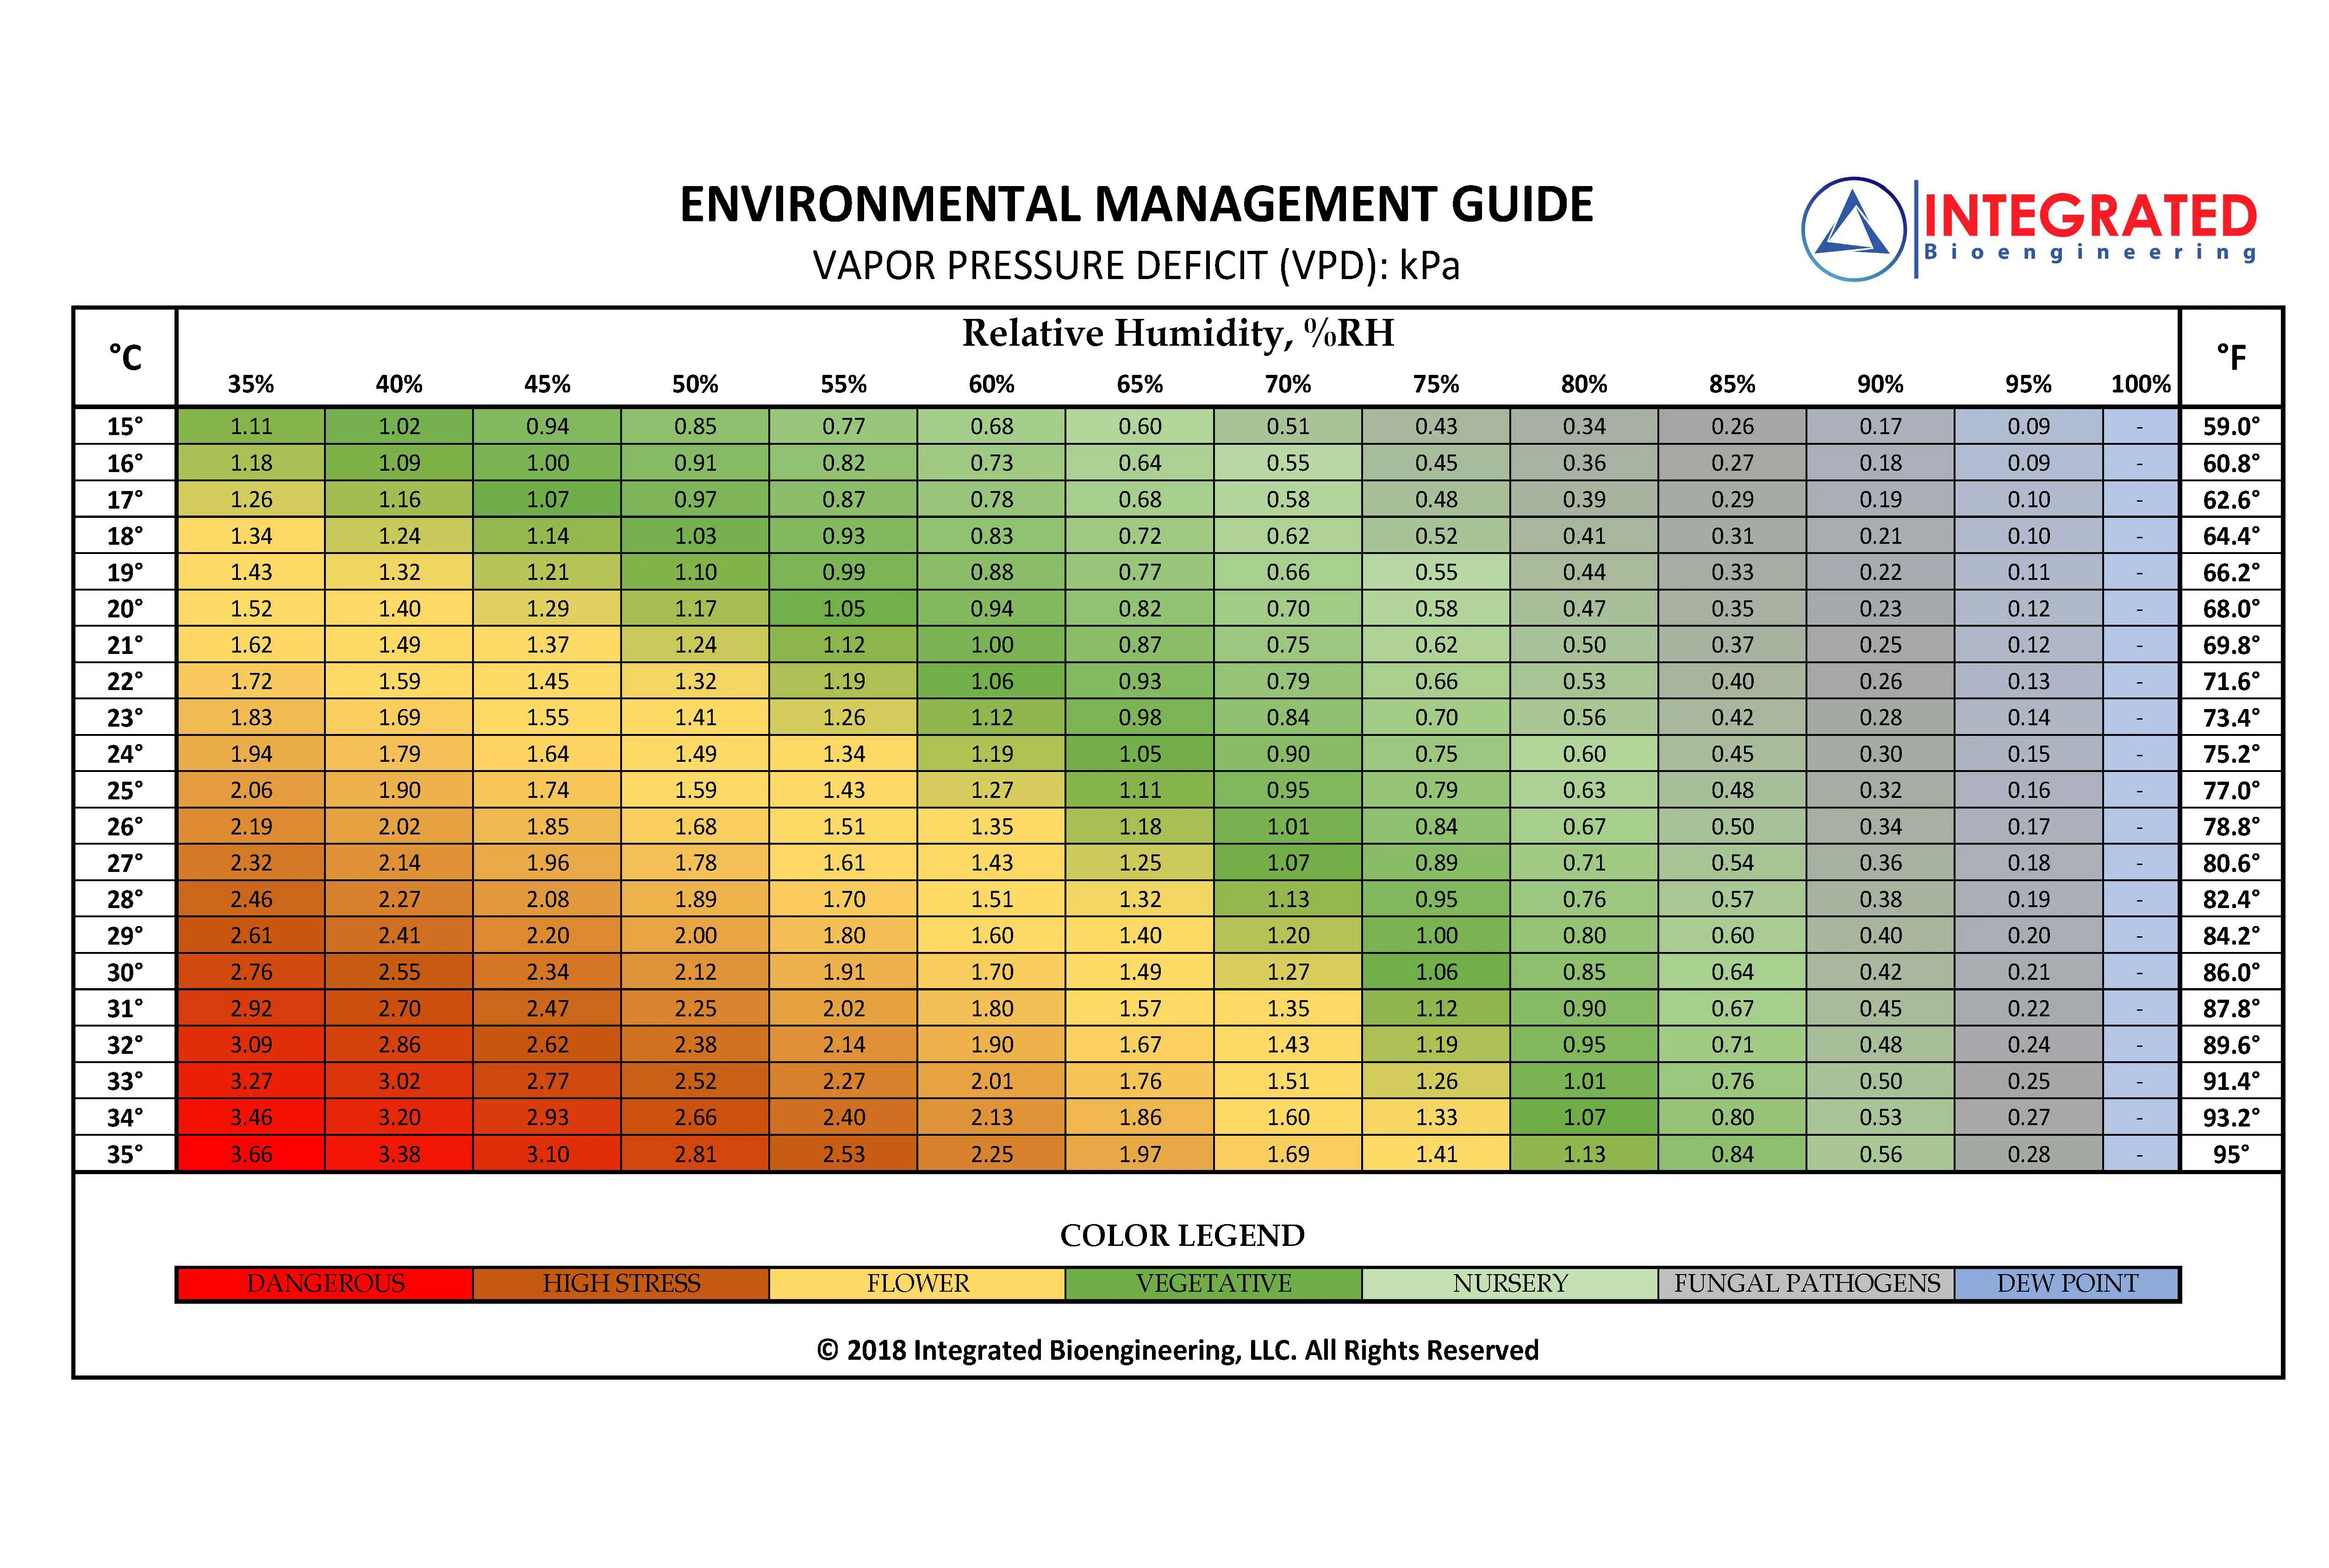 Let’s say the RH is held stable at 70% in a growing environment (find the 70% column on the graph). If the temperature hits 90°F (32°C) during the warmest of the day, then swings down to 60°F (15°C) at night (from near the bottom row to near the top) a flowering plant will go from a healthy VPD to a stressed VPD.
Now let’s take it one step farther. Imagine during the hottest part of the day the humidity drops from 70% to 50%. Now the same flowering plant is in a critically stressful environment during the day as well. This scenario is not uncommon for a summer day in a vented greenhouse. Here is actual VPD data from a vented greenhouse located in Loveland, CO on July 1st, 2018:
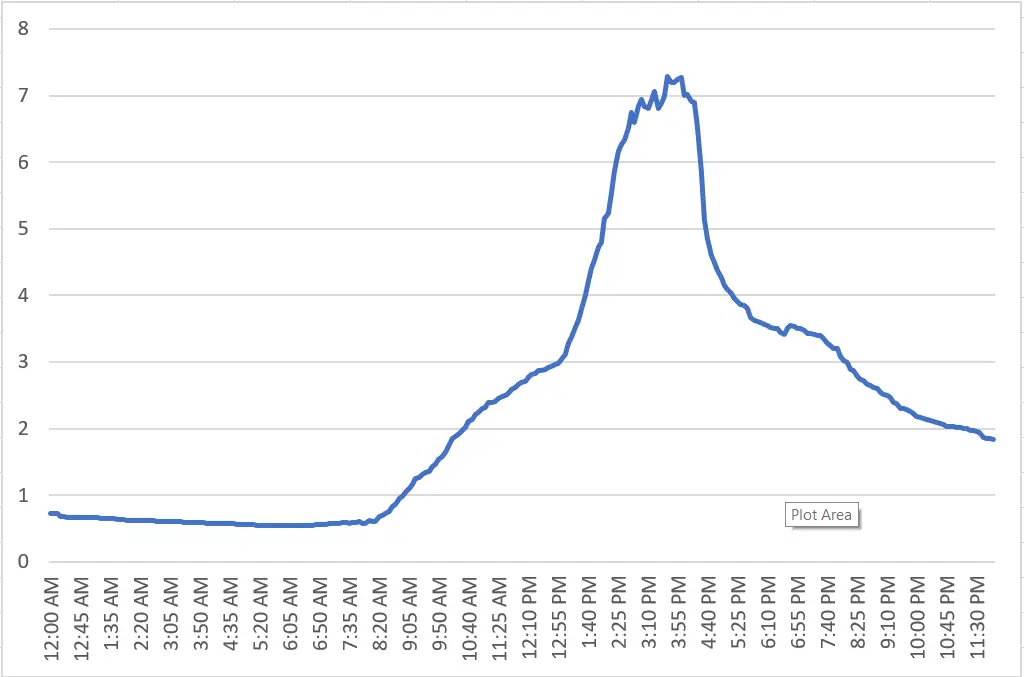 Just as in the scenario above, the VPD calculations spiked to above 7kPa during the afternoon when the temperature soared and the RH dropped. During the strongest sunlight of the day, the plant is critically stressed and cannot photosynthesize or grow.
How do we use VPD chart calculations?
At Ceres, we utilize VPD chart calculations to determine how the plants’ environment changes due to HVACD systems and then program our SunSense™greenhouse controller to optimize the environment. Many cannabis growers find it helpful to reference a VPD chart for cannabis to determine the optimal temperature and humidity ranges for each stage of growth.
How to Calculate Vapor Pressure Deficit
To calculate VPD we measure the temperature at the plant canopy level and then measure the temperature of the ambient greenhouse. Our research has shown these basic trends:
- Heating and solar radiation increase VPD
- Evaporation, through evaporative coolers and from evapotranspiration, decreases VPD
- Misters/sprayers decrease VPD
- Ventilation increases VPD
- Air conditioning increases VPD
Based on the deficit or surplus pressure experienced by the plant in relation to ideal VPD, ourgreenhouse control system,the Ceres SunSense™, will implement stages of heating/cooling to maintain the perfect balance of temperature and RH to optimize your yield.
For more information on greenhouse VPD control and cannabis VPD be sure to read about our geothermal HVACD system, theCeres EcoLoop™ and our sealed greenhouse solution, theSunChamber™.
If you have a project in mind and would like to speak to a greenhouse expert,contact us today!